
📊 TRXUSDT January 2026 — Liquidity Harvesting Backtest
Backtest that proves Crypto Yoda Channel signals work better in reverse: SHORT signals are opened as LONG, direction determined by 4h range midpoint.
![]()

![]()
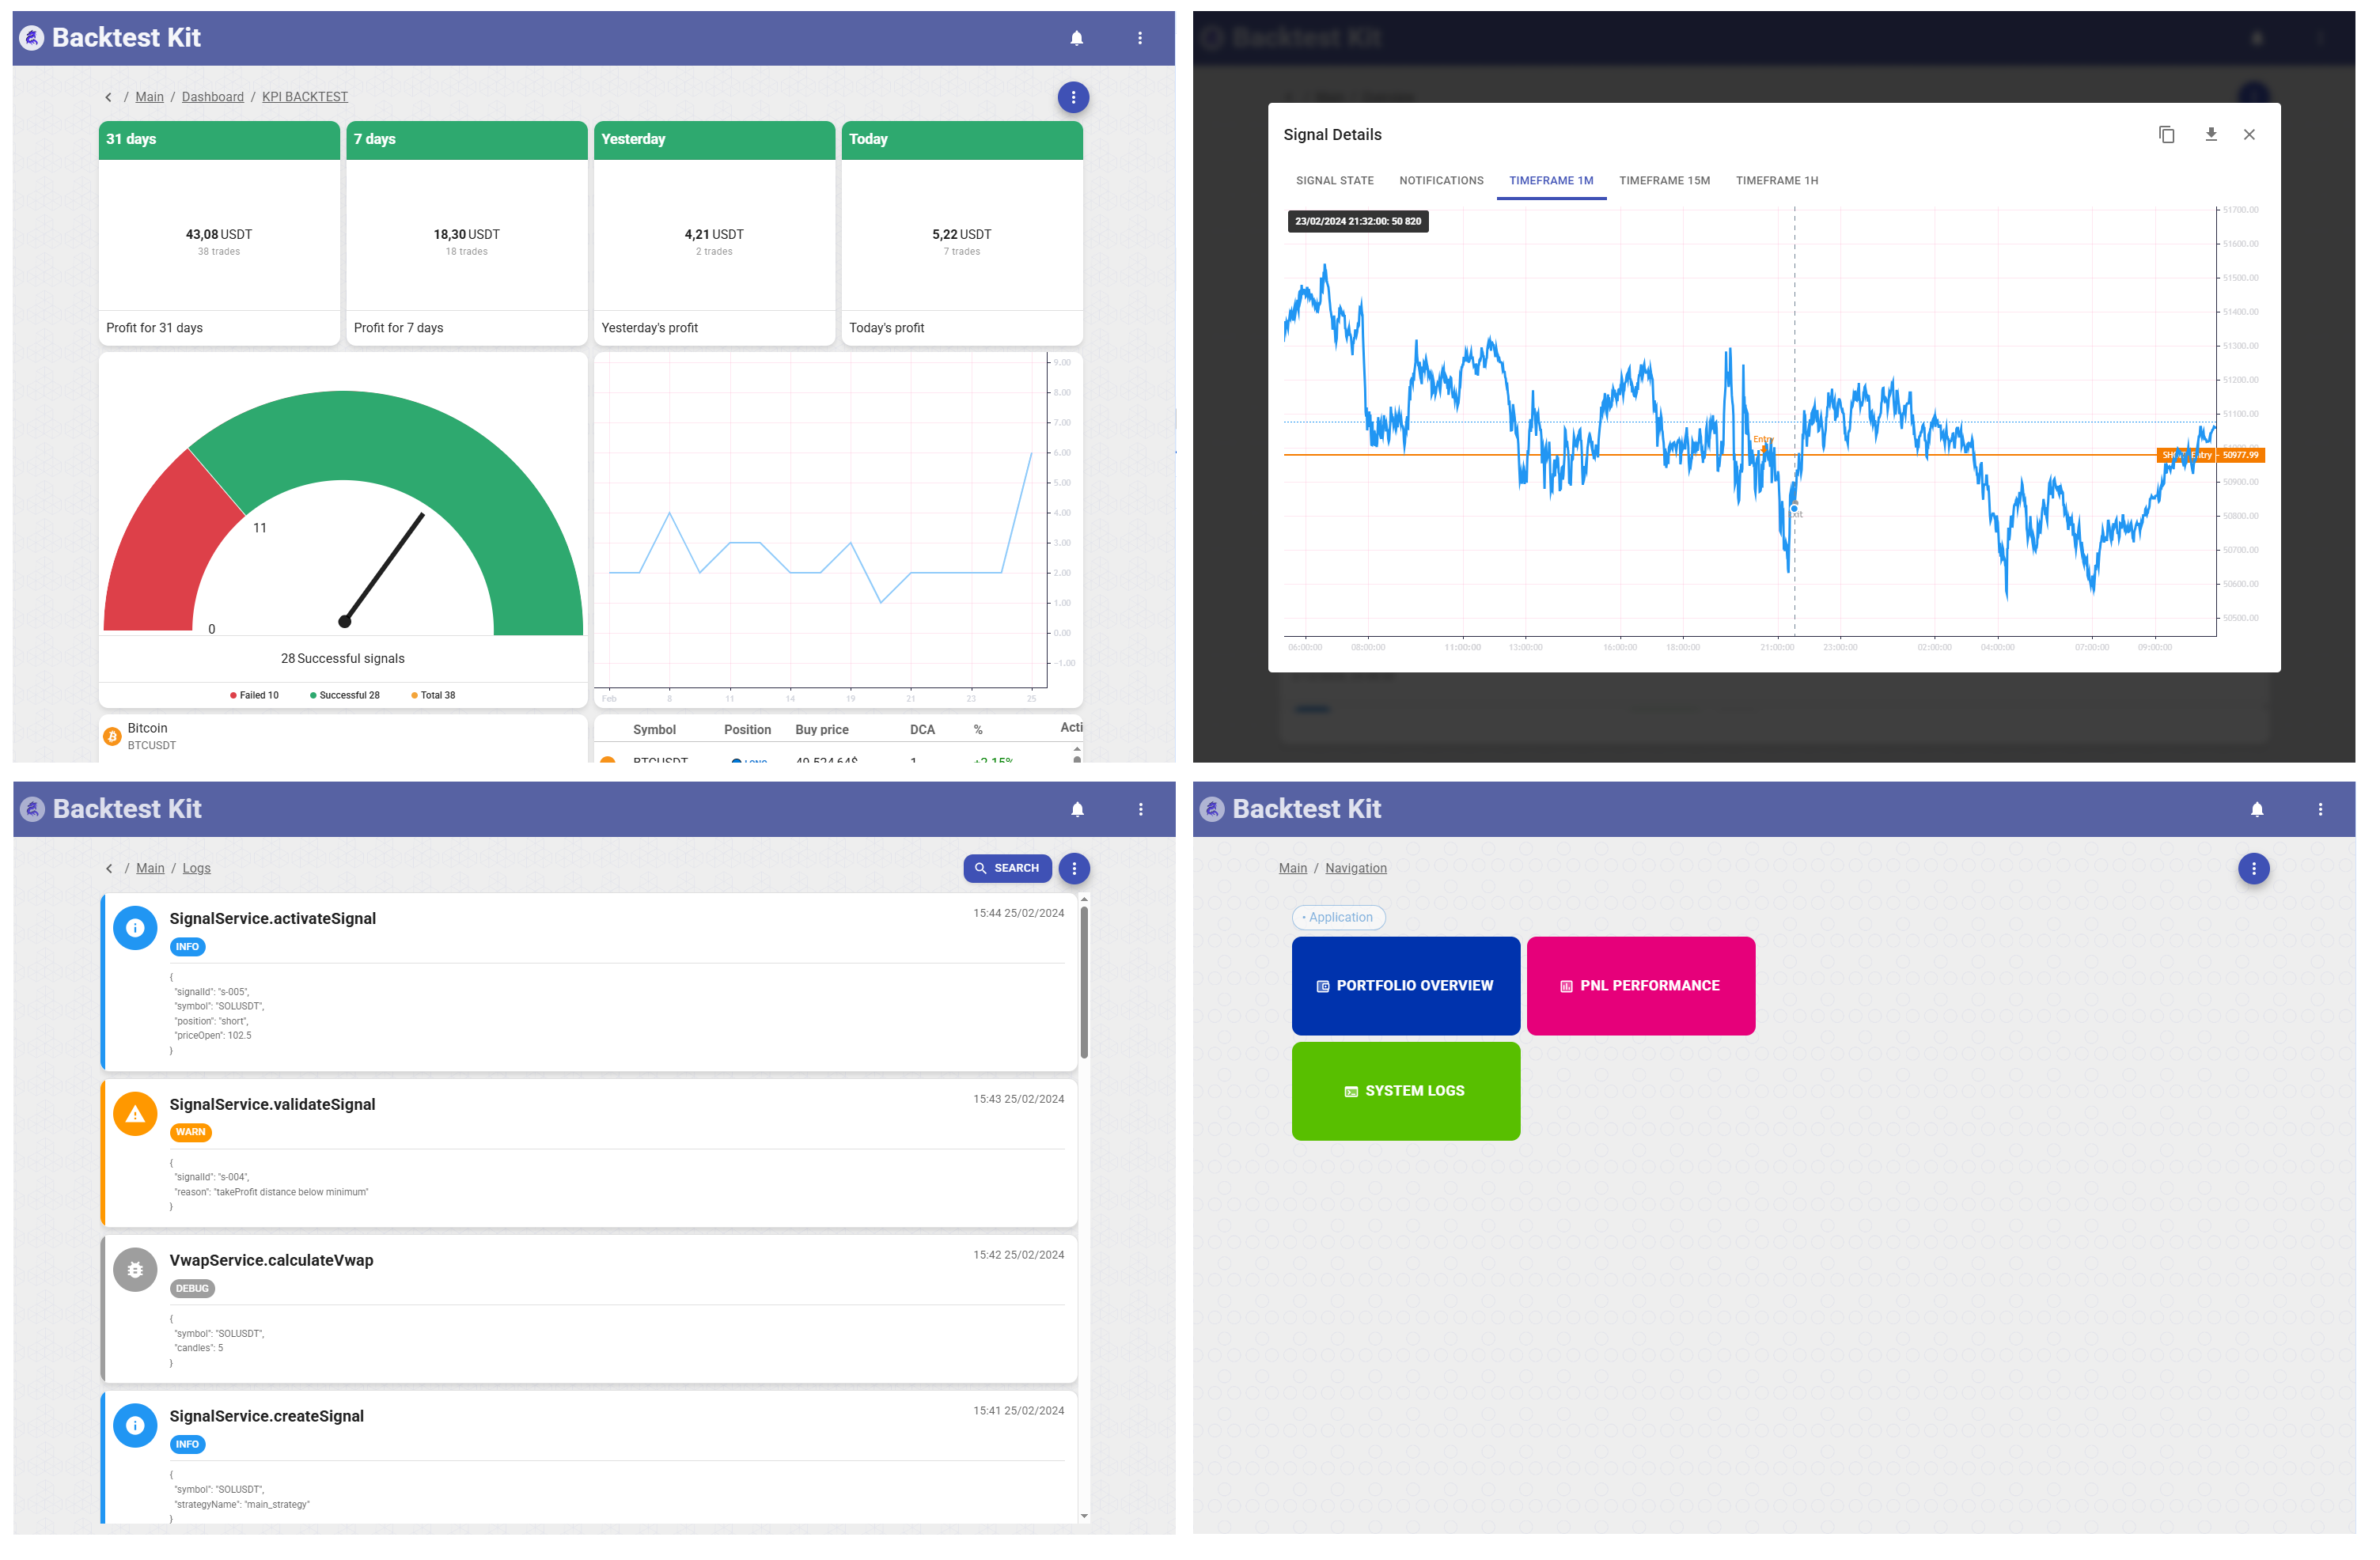
The strategy takes published signals from a real Telegram crypto channel (Crypto Yoda), enters at the same price zone and timestamp, but inverts the direction based on the 4h candle range midpoint. Positions close on a trailing take-profit (1% drawdown from peak) or peak staleness (peak >1% held for >240 min).
Strategy: jan_2026_strategy | Exchange: ccxt-exchange | Frame: jan_2026_frame
🚀 Quick Start
Link to the source code
npm start -- --backtest --symbol TRXUSDT ./content/jan_2026.strategy/jan_2026.strategy.ts
🔍 Methodology
The channel publishes SHORT signals with average R:R of 0.375:1 and 106% deposit at risk at 25× leverage — mathematically guaranteed to lose. Fifteen minutes before each post a volume spike appears on the chart; the TP step multipliers and T5/SL ratio are identical across all signals, indicating an algorithm.
All 8 SHORT signals on TRXUSDT in January 2026 moved sharply in the opposite direction within 45 minutes of publication. The strategy exploits this by entering against the published direction: if the 1m close is below the 4h range midpoint, open LONG; exit on a 1% trailing drawdown from peak or peak staleness after 240 minutes.
Full statistical analysis of 416 signals and 17 documented SHORT→LONG pairs is in assets/REPORT_EN.md.
📉 Price Context (January 2026)
| Metric | Value |
|---|---|
| Period | Jan 6 – Jan 30, 2026 |
| Ticker | TRXUSDT |
| Price range | ~$0.288 – ~$0.315 |
| Dominant move | Range consolidation with upside breakout mid-January |
TRXUSDT spent most of January consolidating in a tight $0.288–$0.310 range. The channel repeatedly published SHORT signals near the range bottom, betting on a breakdown that never came. Mid-January the price broke above $0.305 and held, generating the profitable LONG window exploited by the inverted strategy.
✨ Performance Summary
Before (original signals, results_before.json)
| Metric | Value |
|---|---|
| Total trades | 10 |
| Net PNL | −5.05% |
| Win rate | 20% (2 / 10) |
| Winners | 2 LONGs (channel's own LONG signals) |
| Losers | 8 SHORTs (channel's SHORT signals) |
| Exit method | All by 4 h timeout |
After (inverted signals, results_after.json)
| Metric | Value |
|---|---|
| Total trades | 8 |
| Net PNL | +8.58% |
| Win rate | 87.5% (7 / 8) |
| Avg win | +1.17% |
| Avg loss | −0.70% |
| Best trade | +2.54% (LONG Jan 22) |
| Worst trade | −0.70% (LONG Jan 26, SL hit) |
| Closed by trailing take | 4 |
| Closed by peak staleness | 3 |
| Closed by stop-loss | 1 |
Risk-Adjusted Metrics
Individual trade PNL values (inverted strategy): +0.99, +0.77, +0.83, +0.007, +1.62, +2.09, +2.54, −0.70, +1.18
| Metric | Before | After |
|---|---|---|
| Mean trade PNL | −0.505% | +1.036% |
| Std dev per trade | 0.810% | 0.942% |
| Sharpe Ratio (per-trade) | −0.63 | +1.14 |
| Max drawdown (single trade) | −1.33% | −0.70% |
| Profit factor | 0.56 | 7.31 |
| Expectancy per trade | −$0.51 | +$1.04 |
Sharpe Ratio = mean(PNL) / std(PNL), computed per-trade without risk-free rate adjustment (annualisation is not meaningful for a 25-day, 8-trade sample).
Profit factor = gross profit / gross loss. Before: $1.51 won / $2.70 lost = 0.56. After: $7.44 won / $0.70 lost = 7.31.
The inverted strategy's Sharpe of 1.14 indicates the mean return comfortably exceeds one standard deviation of trade-level noise — a level conventionally considered acceptable for systematic strategies. The baseline Sharpe of −0.63 confirms the original signals have negative expected value regardless of execution quality.
📋 Trade Log (After — Inverted)
| # | Signal date | Original dir | Actual dir | Open | Close | PNL% | Exit |
|---|---|---|---|---|---|---|---|
| 1 | Jan 6 10:16 | SHORT | LONG | $0.2915 | $0.2924 | +0.99% | trailing take |
| 2 | Jan 6 18:47 | SHORT | LONG | $0.2920 | $0.2931 | +0.77% (est.) | trailing take |
| 3 | Jan 9 14:06 | SHORT | LONG | $0.2948 | $0.2985 | +0.83% | peak staleness |
| 4 | Jan 12 13:08 | SHORT | LONG | $0.2979 | $0.2981 | +0.007% | trailing take |
| 5 | Jan 15 12:10 | LONG | LONG | $0.3054 | $0.3116 | +1.62% | peak staleness |
| 6 | Jan 16 17:58 | LONG | LONG | $0.3081 | $0.3157 | +2.09% | trailing take |
| 7 | Jan 22 09:15 | SHORT | LONG | $0.2998 | $0.3086 | +2.54% | trailing take |
| 8 | Jan 26 10:50 | SHORT | LONG | $0.2956 | $0.2947 | −0.70% | stop-loss |
| — | Jan 27 09:09 | SHORT | — | — | — | — | not triggered |
| — | Jan 30 12:18 | SHORT | LONG | $0.2894 | $0.2940 | +1.18% | peak staleness |
Trades 8 and 10 differ in count because Jan 27 did not trigger (close price outside entry zone at signal time).
📈 Equity Curve (After)
| After trade | Cumulative PNL% |
|---|---|
| 1 — Jan 6 | +0.99% |
| 2 — Jan 6 | +1.76% |
| 3 — Jan 9 | +2.59% |
| 4 — Jan 12 | +2.60% |
| 5 — Jan 15 | +4.22% |
| 6 — Jan 16 | +6.31% |
| 7 — Jan 22 | +8.85% ← peak |
| 8 — Jan 26 | +8.15% |
| … — Jan 30 | +9.33% |
🚀 How to Run
npm start -- --backtest --symbol TRXUSDT \
--strategy jan_2026_strategy \
--exchange ccxt-exchange \
--frame jan_2026_frame \
./content/jan_2026.strategy/jan_2026.strategy.ts
Add --ui to open the web dashboard at http://localhost:60050:
npm start -- --backtest --symbol TRXUSDT --ui \
./content/jan_2026.strategy/jan_2026.strategy.ts
🌍 Environment Variables
Create a .env file in the project root (copy from .env.example):
# Telegram notifications (optional)
CC_TELEGRAM_TOKEN=your_bot_token_here
CC_TELEGRAM_CHANNEL=-100123456789
# Web UI server (optional, defaults shown)
CC_WWWROOT_HOST=0.0.0.0
CC_WWWROOT_PORT=60050