
📊 BTCUSDT April 2026 — DCA Ladder Backtest
Fixed-signal ladder strategy that opens a LONG on every new pending signal, then dollar-cost-averages down up to 10 steps while the position runs, closing at 3% portfolio profit.
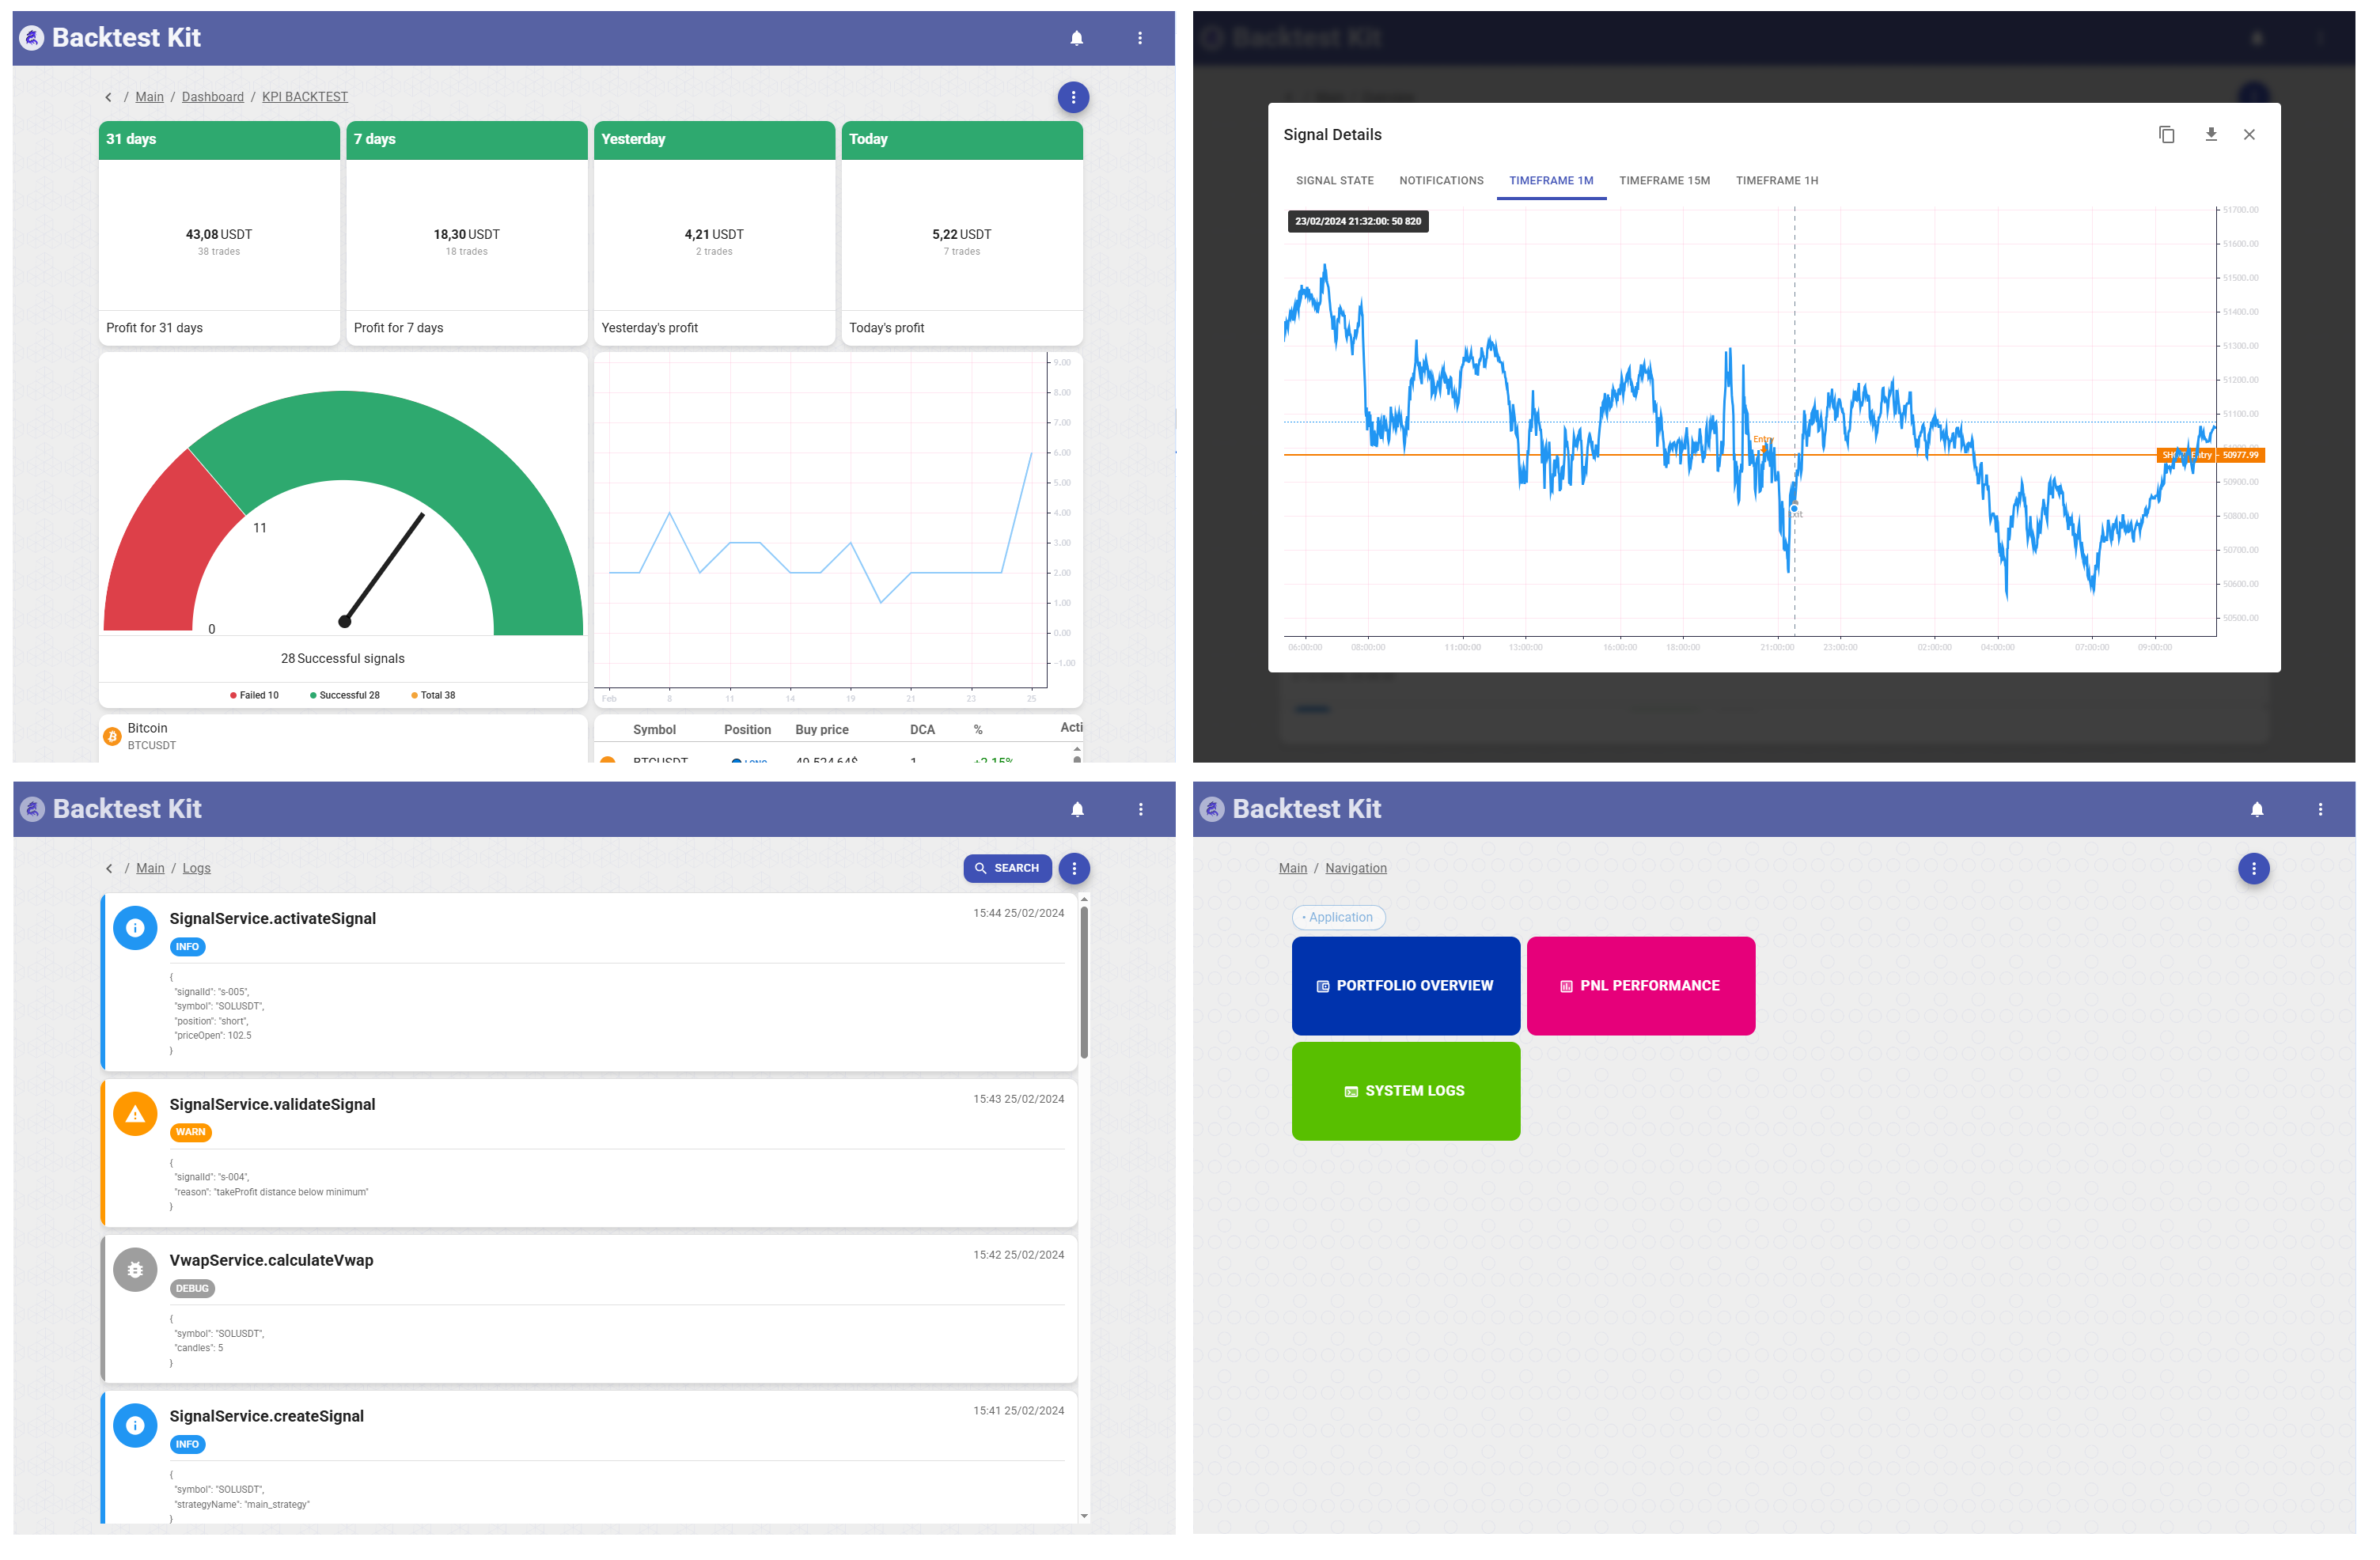
![]()

![]()
Each signal opens a $100 LONG via Position.moonbag (25% hard stop). While the position is active, commitAverageBuy fires whenever price moves outside a ±1–5% band around the last entry, adding another $100 rung up to 10 rungs total. The position closes as soon as portfolio PNL crosses +3%.
Strategy: apr_2026_strategy | Exchange: ccxt-exchange | Frame: apr_2026_frame
🚀 Quick Start
Link to the source code
npm start -- --backtest --symbol BTCUSDT ./content/apr_2026.strategy/apr_2026.strategy.ts
📉 Price Context (April 2026)
| Metric | Value |
|---|---|
| Frame open | ~$68,282 (Apr 1) |
| Frame close | ~$78,737 (Apr 27) |
| Period high | ~$79,382 |
| Period low | ~$65,820 |
| Net move | +15.3% |
April 2026 was a recovery month for BTC after the Q1 tariff shock. Price ground upward from the mid-$60 k range, pulling every DCA position into profit within days of each entry.
✨ Performance Summary
Without DCA (single-entry, before.json)
| Metric | Value |
|---|---|
| Total trades | 5 |
| Entries per trade | 1 (fixed) |
| Total deployed capital | $500 |
| Net PNL ($) | +$12.45 |
| Net PNL (%) | +12.45% |
| Win rate | 100% (5 / 5) |
| Avg PNL per trade | +$2.49 |
| Best trade | +$3.20 (Apr 1, +3.20%) |
| Worst trade | +$0.19 (Apr 26, +0.19%) |
| Worst drawdown (%) | −3.99% (single entry) |
| Worst drawdown ($) | −$3.99 |
With DCA (ladder up to 10 entries)
| Metric | Value |
|---|---|
| Total trades | 7 |
| Avg entries per trade | 2.4 |
| Max entries in one trade | 5 |
| Total deployed capital | $1,700 |
| Net PNL ($) | +$67.85 |
| Net PNL (%) | +67.85% on capital deployed |
| Win rate | 100% (7 / 7) |
| Avg PNL per trade | +$9.69 |
| Best trade | +$16.53 (5 entries, +3.31% blended) |
| Worst trade | +$1.56 (1 entry, +0.78%) |
| Worst drawdown (%) | −2.59% (blended across entries) |
| Worst drawdown ($) | −$12.64 |
📊 DCA vs No-DCA Comparison
| Metric | No DCA | With DCA | Delta |
|---|---|---|---|
| Trades | 5 | 7 | +2 |
| Total capital deployed ($) | $500 | $1,700 | +$1,200 |
| Net PNL ($) | $12.45 | $67.85 | +$55.40 |
| Net PNL on capital (%) | +2.49% avg/trade | +3.99% avg/trade | +1.50 pp |
| Worst drawdown (% per-entry) | −3.99% | −2.59% | −1.40 pp |
| Worst drawdown ($) | −$3.99 | −$12.64 | +$8.65 in fiat |
DCA nearly triples gross dollar profit by deploying more capital into falling prices, while blended drawdown percentage actually improves (−2.59% vs −3.99%) because averaging down lowers the effective price. The trade-off is higher absolute fiat exposure: a worst-case drawdown of −$12.64 vs −$3.99.
📋 Trade Log — Without DCA
| # | Open date | Entries | Open price | Close price | PNL% | PNL$ | Max drawdown% | Max drawdown$ |
|---|---|---|---|---|---|---|---|---|
| 1 | Apr 1 | 1 | $68,282 | $70,747 | +3.20% | +$3.20 | −3.99% | −$3.99 |
| 2 | Apr 9 | 1 | $70,747 | $73,145 | +2.98% | +$2.98 | −0.69% | −$0.69 |
| 3 | Apr 14 | 1 | $73,145 | $75,669 | +3.04% | +$3.04 | −3.87% | −$3.87 |
| 4 | Apr 22 | 1 | $75,669 | $78,272 | +3.03% | +$3.03 | −3.23% | −$3.23 |
| 5 | Apr 26 | 1 | $78,272 | $78,737 | +0.19% | +$0.19 | −1.90% | −$1.90 |
| Σ | 5 | +$12.45 | −13.68% | −$13.68 |
📋 Trade Log — With DCA
| # | Open date | Entries | Blended open | Close price | PNL% (blended) | PNL$ | Max drawdown% | Max drawdown$ |
|---|---|---|---|---|---|---|---|---|
| 1 | Apr 1 | 4 | $67,296 | $69,773 | +3.27% | +$13.08 | −2.59% | −$10.34 |
| 2 | Apr 9 | 3 | $69,114 | $71,501 | +3.04% | +$9.13 | −2.29% | −$6.88 |
| 3 | Apr 14 | 2 | $71,148 | $73,590 | +3.02% | +$6.05 | −1.25% | −$2.49 |
| 4 | Apr 15 | 5 | $72,141 | $74,657 | +3.08% | +$15.39 | −2.53% | −$12.64 |
| 5 | Apr 20 | 5 | $75,401 | $78,203 | +3.31% | +$16.53 | −2.51% | −$12.57 |
| 6 | Apr 23 | 2 | $74,286 | $76,860 | +3.05% | +$6.11 | −1.43% | −$2.85 |
| 7 | Apr 26 | 2 | $77,815 | $78,737 | +0.78% | +$1.56 | −1.32% | −$2.64 |
| Σ | 23 | +$67.85 | −13.92% | −$50.41 |
⚠️ Risk Analysis
Drawdown by percentage (per-position)
DCA lowers the percentage drawdown because averaging down into dips reduces the blended cost basis:
- No DCA worst: −3.99% (Apr 1 single entry at $68,282 before the dip to $65,820)
- DCA worst: −2.59% (4-entry blended basis ~$67,296, same dip)
Drawdown in fiat (absolute dollar loss)
DCA increases the absolute dollar at risk because more capital is deployed per position:
- No DCA worst: −$3.99 (1 × $100 entry)
- DCA worst: −$12.64 (5 × $100 entries = $500 deployed in one position)
Summary
| Risk metric | No DCA | With DCA |
|---|---|---|
| Max drawdown per position (%) | −3.99% | −2.59% |
| Max drawdown per position ($) | −$3.99 | −$12.64 |
| Capital at risk (worst position) | $100 | $500 |
| Hard stop distance | 25% | 25% |
| Max theoretical loss (worst, 10 rungs) | −$250 | −$2,500 |
The DCA ladder is percentage-safer but fiat-riskier. In a sustained downtrend that hits the 25% hard stop with all 10 rungs filled, the maximum single-position loss is $2,500 vs $250 for a single-entry approach.
🚀 How to Run
# With DCA ladder (current strategy)
npm start -- --backtest --symbol BTCUSDT \
--strategy apr_2026_strategy \
--exchange ccxt-exchange \
--frame apr_2026_frame \
./content/apr_2026.strategy/apr_2026.strategy.ts
# Without DCA (single-entry variant)
npm start -- --backtest --symbol BTCUSDT \
--strategy apr_2026_strategy \
--exchange ccxt-exchange \
--frame apr_2026_frame \
./content/apr_2026.strategy/apr_2026.test.ts
Add --ui to open the web dashboard at http://localhost:60050:
npm start -- --backtest --symbol BTCUSDT --ui \
./content/apr_2026.strategy/apr_2026.strategy.ts
🌍 Environment Variables
Create a .env file in the project root (copy from .env.example):
# Telegram notifications (optional)
CC_TELEGRAM_TOKEN=your_bot_token_here
CC_TELEGRAM_CHANNEL=-100123456789
# Web UI server (optional, defaults shown)
CC_WWWROOT_HOST=0.0.0.0
CC_WWWROOT_PORT=60050