
📊 BTCUSDT April 2024 — Polymarket Δprob Backtest
Backtest that uses Polymarket "Bitcoin all-time high" probability shifts (Δprob) as a leading indicator for BTC direction, with a 1% trailing take-profit and 1% hard stop-loss.
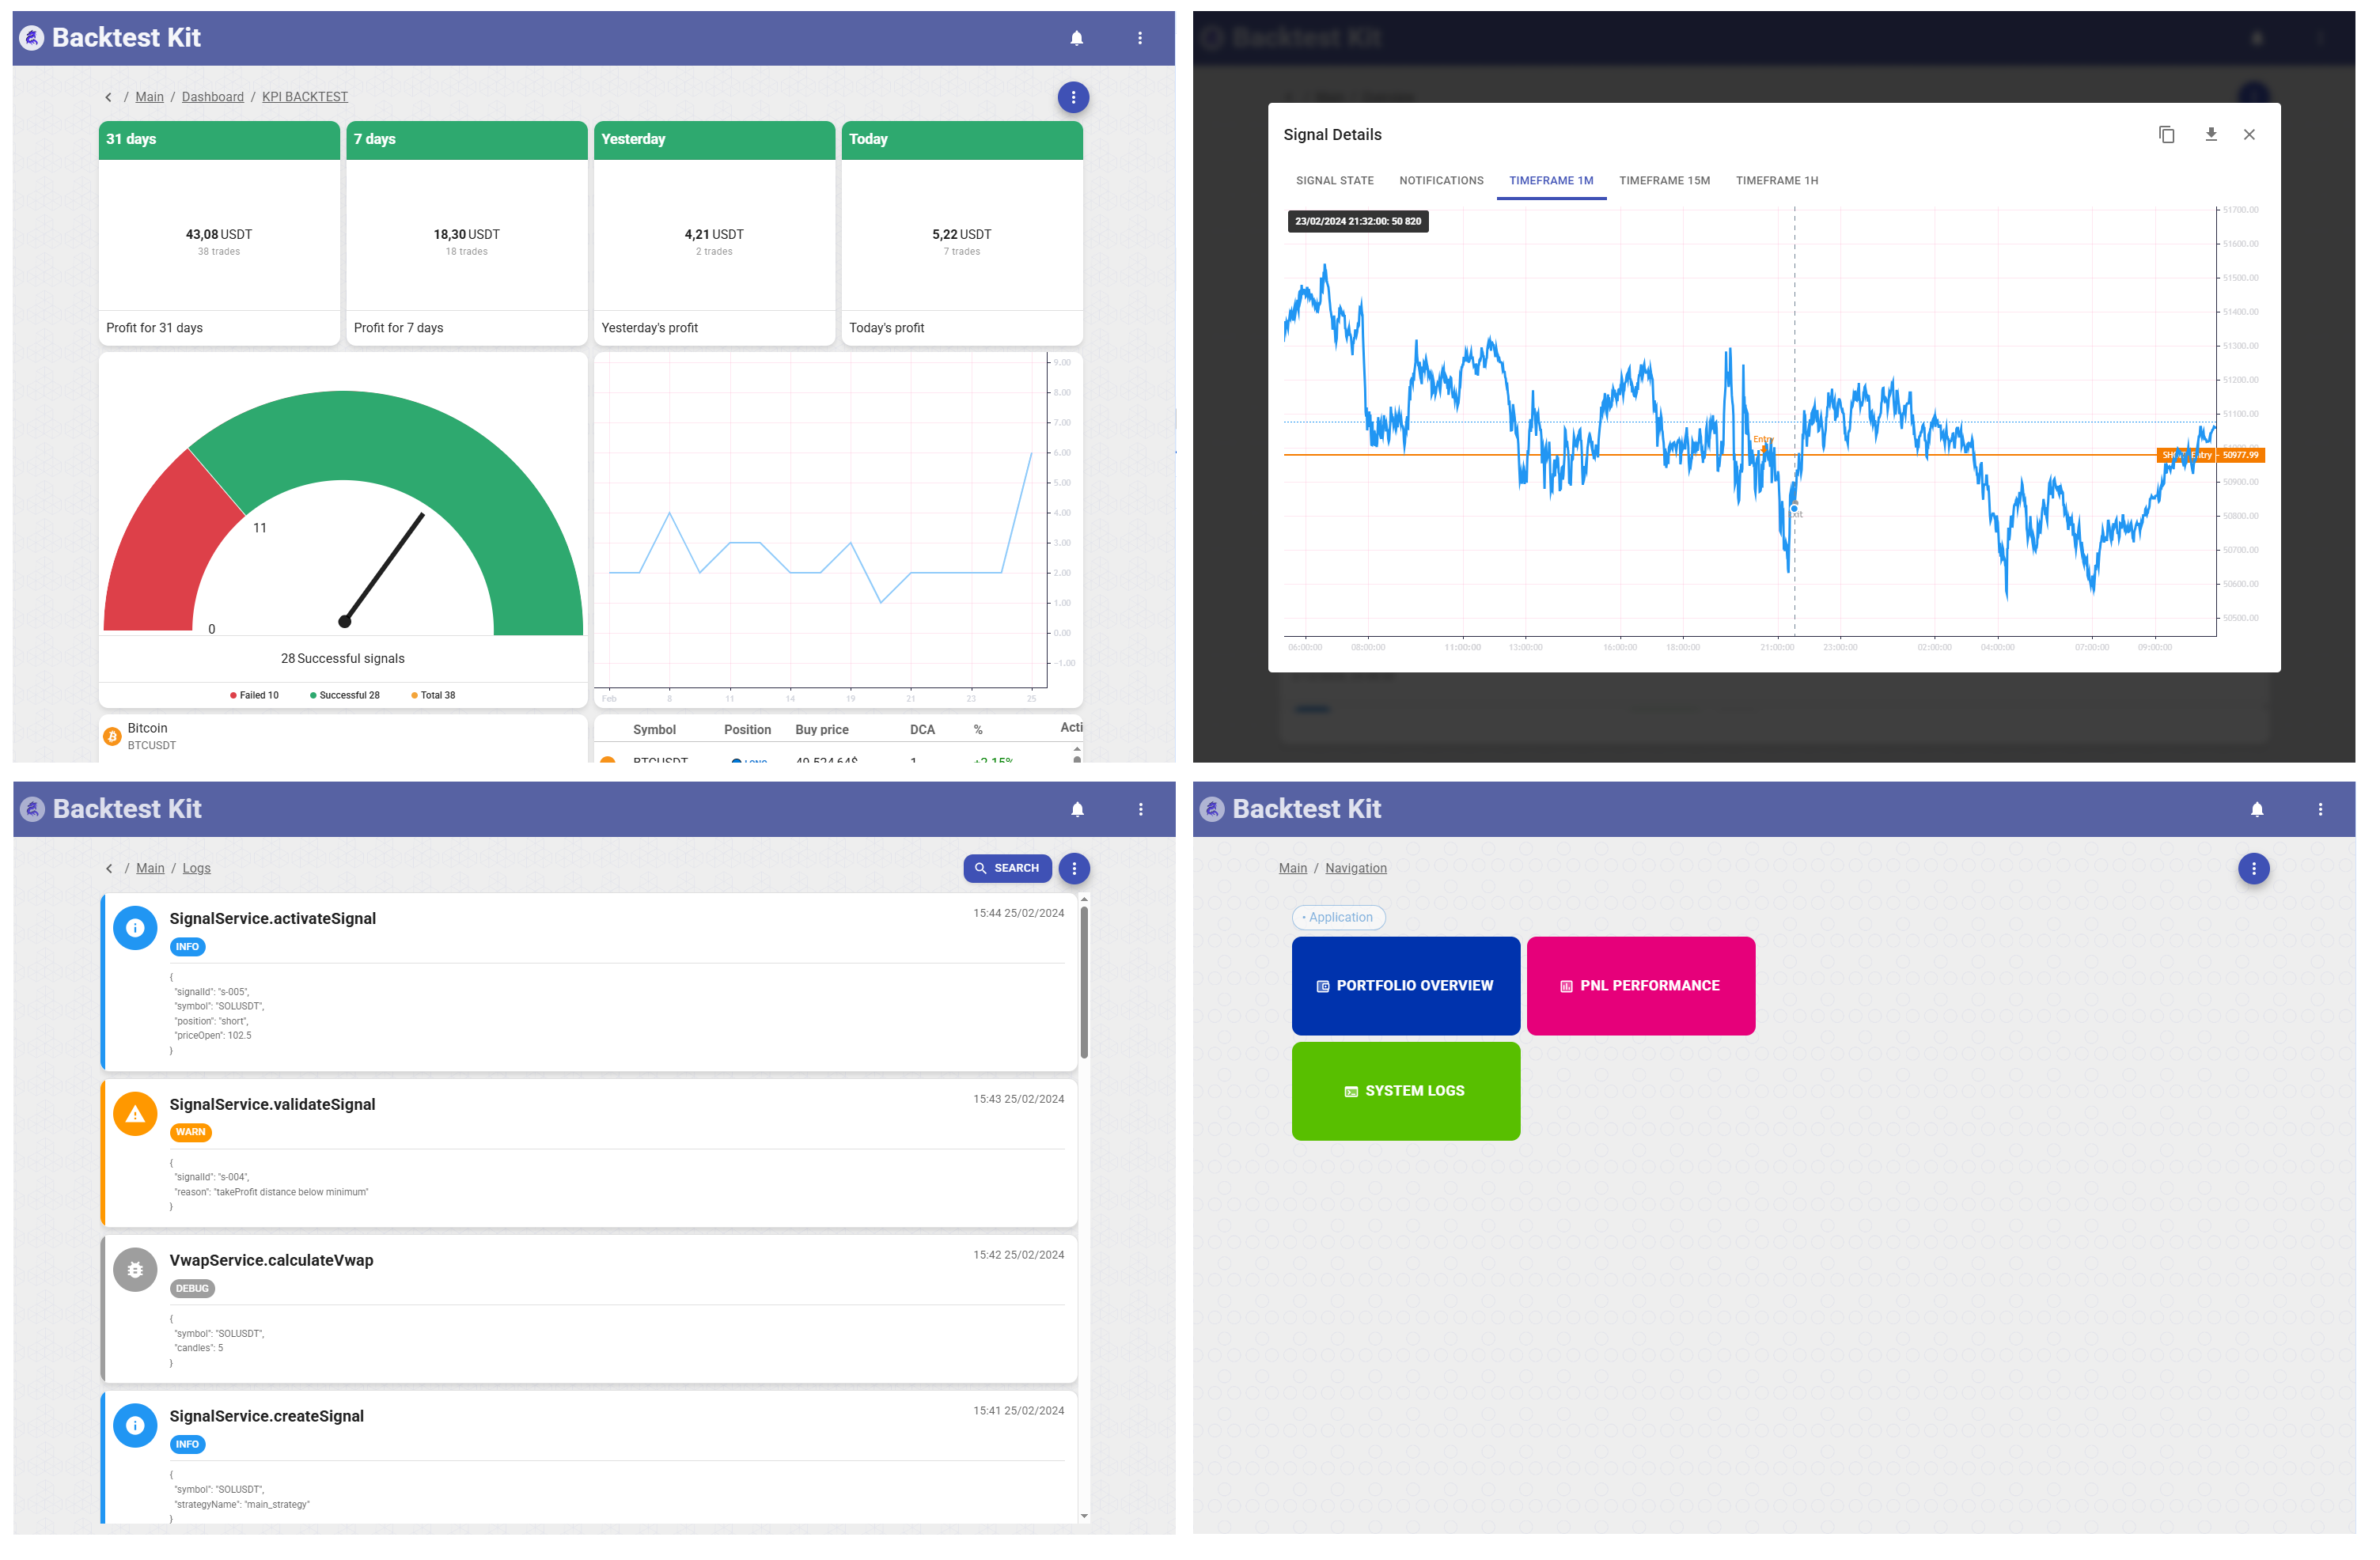
![]()

![]()
The strategy reads Polymarket CLOB daily snapshots (Δprob — change of "yes" probability for crypto-prices markets) from assets/polymarket-backtest-result.json. When |Δprob| ≥ 0.10 and the snapshot is no older than 1h, it opens a position: long on positive Δprob, short on negative. The position runs with a 1% hard stop-loss and 1% trailing take-profit; if the trailing take never arms, the position closes after 24h.
Strategy: apr_2026_strategy | Exchange: ccxt-exchange | Frame: apr_2024_frame
🚀 Quick Start
Link to the source code
npm start -- --backtest --symbol BTCUSDT ./content/apr_2024.strategy/apr_2024.strategy.ts
🔍 Methodology
The signal source is Polymarket prediction-market probability for BTC-related markets (e.g. "Bitcoin all time high in August?"). Each day's "yes" price shift is a market-implied probability change for a BTC-driven event — when it moves sharply, retail flow into Polymarket precedes BTC spot movement by roughly one day.
To remove look-ahead bias, the strategy uses only the timestamp and Δprob from the source JSON — it does not read entryPrice or exitPrice (which were computed in the original polymarket-backtest.ts using future klines). The decision rule is:
- For the current candle time
when, find the most recent Polymarket signal withtimestamp ≤ when. - Reject it if older than
MAX_SIGNAL_AGE_MS = 1hor|dprob| < MIN_ABS_DPROB = 0.10. - Open
long/shortat market withPosition.moonbag(TP off, hard SL = 1%). - Close on 1% trailing drawdown from peak profit, or on 24h timeout.
📉 Price Context (April 2024)
| Metric | Value |
|---|---|
| Period | Apr 1 – Apr 28, 2024 |
| Ticker | BTCUSDT |
| Price range | ~$60,600 – ~$71,600 |
| Dominant move | Topping pattern after April highs, ~13% drawdown into mid-month |
April 2024 captured BTC's local top near $71,600 (Apr 8) followed by a sharp correction to $60,700 (Apr 30) — a regime where Polymarket sentiment swings were unusually pronounced.
✨ Performance Summary
Backtest result
| Metric | Value |
|---|---|
| Total trades | 10 |
| Net PNL | +0.63% |
| Win rate | 70% (7 / 10) |
| Avg win | +0.69% |
| Avg loss | −1.40% |
| Best trade | +1.11% (SHORT Apr 17) |
| Worst trade | −1.40% (SHORT Apr 6, SL) |
| Closed by trailing take | 7 |
| Closed by hard stop-loss | 3 |
| Direction split | 8 SHORT / 2 LONG |
Risk-Adjusted Metrics
Individual trade PNL values: −1.40, −1.40, −1.40, +0.62, +0.35, +0.89, +0.87, +1.11, +0.57, +0.42
| Metric | Value |
|---|---|
| Mean trade PNL | +0.063% |
| Std dev per trade | 0.981% |
| Sharpe Ratio (per-trade) | +0.065 |
| Max drawdown (single trade) | −1.40% |
| Profit factor | 1.15 |
| Expectancy per trade | +$0.06 |
Sharpe Ratio = mean(PNL) / std(PNL), per-trade, no risk-free adjustment (10-trade sample over 28 days makes annualisation meaningless).
Profit factor = gross profit / gross loss = 4.83% won / 4.20% lost = 1.15.
The 70% win rate is encouraging but per-trade Sharpe of 0.065 is statistically indistinguishable from zero — the three SL hits (−1.40% each) almost exactly cancel the seven trailing-take wins. The strategy survives April 2024 but does not produce a robust edge at the current MIN_ABS_DPROB = 0.10 threshold; higher thresholds (≥0.15) or volatility filters are likely needed to suppress the LONG signals during the topping phase (trades 1 and 3 were both LONGs that hit SL on the way down).
📋 Trade Log
| # | Opened (UTC) | Closed (UTC) | Held | Dir | Δprob | Open | Close | Peak | DD | PNL% | Exit |
|---|---|---|---|---|---|---|---|---|---|---|---|
| 1 | Apr 5 00:01 | Apr 5 02:36 | 2.6h | LONG | +0.130 | $68,465.24 | $67,780.59 | −0.12% | −1.37% | −1.40% | stop-loss |
| 2 | Apr 6 00:01 | Apr 6 22:12 | 22.2h | SHORT | −0.180 | $67,811.75 | $68,489.87 | +0.09% | −1.40% | −1.40% | stop-loss |
| 3 | Apr 9 00:01 | Apr 9 06:40 | 6.7h | LONG | +0.140 | $71,627.28 | $70,911.00 | −0.27% | −1.35% | −1.40% | stop-loss |
| 4 | Apr 10 00:01 | Apr 10 14:21 | 14.3h | SHORT | −0.110 | $69,144.88 | $68,438.99 | +1.77% | −0.90% | +0.62% | trailing take |
| 5 | Apr 13 00:01 | Apr 13 03:04 | 3.0h | SHORT | −0.345 | $67,125.52 | $66,624.34 | +1.47% | −0.40% | +0.35% | trailing take |
| 6 | Apr 14 00:01 | Apr 14 03:37 | 3.6h | SHORT | −0.170 | $63,910.38 | $63,088.37 | +2.19% | −0.89% | +0.89% | trailing take |
| 7 | Apr 16 00:01 | Apr 16 05:19 | 5.3h | SHORT | −0.135 | $63,406.47 | $62,605.77 | +1.95% | −1.03% | +0.87% | trailing take |
| 8 | Apr 17 00:01 | Apr 17 13:44 | 13.7h | SHORT | −0.140 | $63,789.80 | $62,829.23 | +2.15% | −1.39% | +1.11% | trailing take |
| 9 | Apr 25 00:01 | Apr 25 14:11 | 14.2h | SHORT | −0.125 | $64,275.82 | $63,651.86 | +1.71% | −1.08% | +0.57% | trailing take |
| 10 | Apr 27 00:01 | Apr 27 02:35 | 2.6h | SHORT | −0.170 | $63,775.30 | $63,254.50 | +1.48% | −0.56% | +0.42% | trailing take |
📈 Equity Curve
| After trade | Cumulative PNL% |
|---|---|
| 1 — Apr 5 | −1.40% |
| 2 — Apr 6 | −2.80% |
| 3 — Apr 9 | −4.20% ← trough |
| 4 — Apr 10 | −3.57% |
| 5 — Apr 13 | −3.22% |
| 6 — Apr 14 | −2.33% |
| 7 — Apr 16 | −1.47% |
| 8 — Apr 17 | −0.36% |
| 9 — Apr 25 | +0.21% |
| 10 — Apr 27 | +0.63% |
The first three trades all hit the 1% SL, producing a −4.20% drawdown by Apr 9. From Apr 10 onward only SHORT signals fired, and seven consecutive trailing-take exits recovered the deficit by Apr 27.
🚀 How to Run
npm start -- --backtest --symbol BTCUSDT \
--strategy apr_2026_strategy \
--exchange ccxt-exchange \
--frame apr_2024_frame \
./content/apr_2024.strategy/apr_2024.strategy.ts
Add --ui to open the web dashboard at http://localhost:60050:
npm start -- --backtest --symbol BTCUSDT --ui \
./content/apr_2024.strategy/apr_2024.strategy.ts
🌍 Environment Variables
Create a .env file in the project root (copy from .env.example):
# Telegram notifications (optional)
CC_TELEGRAM_TOKEN=your_bot_token_here
CC_TELEGRAM_CHANNEL=-100123456789
# Web UI server (optional, defaults shown)
CC_WWWROOT_HOST=0.0.0.0
CC_WWWROOT_PORT=60050