📊 How AI Got Hands for Stock Trading
The source code discussed in the article is available at this link
In paintings or heraldry, Saint George is always depicted with a spear. But why a spear? You could depict a bow, sword, or mace. The long shaft of the spear reaches up into the clouds to the heavens (the lord): knowledge and power work with an instrument of action like left and right legs.

This is exactly the problem with Claude Code.
Claude Code is an AI agent from Anthropic for autonomous code development. It possesses superhuman pattern recognition, can analyze 50MB of backtest logs in seconds (by inventing and debugging a Python script through test-driven development), determine why 80% of trades close at timeout or SL, and modify Pine Script indicators with surgical precision.
But it has no hands.
The TradingView Problem: The Human Becomes the Bottleneck
If we discard the marketing, the real process of creating an automated production trading strategy looks like this. TradingView replaced MetaTrader, trading strategies are written on it.
- Write a strategy in the Pine Script web editor on the TradingView website.
- Run a backtest (limit ~5000 bars if you don't have a bank card).
- Download CSV.
- Send to Claude/Grok/DeepSeek
- Change one line.
- Repeat.
The iteration cost is too high due to clumsy human hands: the number of CSV files either turns the downloads folder into a mess, or running a week's worth of backtest time takes a day of thoughtful work because you need to name and organize files into folders. A human physically can't work that long.
And you can also send the wrong file to the chat and catch look-ahead bias.
The Architectural Flaw of Pine Script
The Pine Script language is syntactic sugar for a for loop where variables are declared both inside and outside the loop block.
// Local in the candle iteration loop
long_cond = ta.crossover(ema_fast, ema_slow) and rsi > 40 and rsi < 65 and trend_up and vol_spike and mom_up
short_cond = ta.crossunder(ema_fast, ema_slow) and rsi < 60 and rsi > 35 and trend_down and vol_spike and mom_down
// Global outside the loop
var int bars_since_signal = 0
As a consequence, if you need to wait for favorable conditions on both fast (15m) and long (4h) timeframes, you get workarounds:
ema200_4h = request.security(
syminfo.tickerid,
"240",
ta.ema(close, 200),
lookahead = barmerge.lookahead_off
)
The closest analogy to this code from mathematics is a complex number. The number itself means nothing: you need the dynamics of change in a series of numbers (whether it's generally growing or falling). And double for loops are inefficient (quadratic complexity), so they weren't implemented. And it's also unclear what barmerge.lookahead_off does.
// Is this correct?
breakeven = entryPrice * (1 + commissionPct * 2 + slippagePct * 2)
// Or this?
breakeven = entryPrice * (1 + entryFee) / (1 - exitFee - slippage)
// Or maybe this?
trueBreakeven := entryPrice * (1 + entryCommission) / (1 - exitCommission - slippage) * (1 + fundingRate * holdingPeriod / 8)
Things are even more fun with breakeven math: this code is unreadable, any language model hallucination will indistinguishably create a loss. Meanwhile, the programmer will be convinced that the problem is in the indicators.
And Now It Has Hands
To eliminate the human factor, you need to create a system that will:
-
Run Pine Script locally self-hosted
Already done at https://github.com/QuantForgeOrg/PineTS. Indicator visualization is already open source, trading strategies are not interesting within the scope of the article.
-
Ensure time synchronization outside of LLM-editable code
Covered in the article Look ahead Bias. It's important to move critical code out of the AI agent's working zone to avoid sloppy work or hallucinations.
-
Same code in backtest/live/paper
Covered in the article Second order chaos. It talks about trading strategies in natural language, but seamless live/paper/dev migration is already done.
-
Maintain structured JSONL logs as markup native to LLM agents
JSONL (JSON Lines) is a format for both datasets in huggingface and for logs. Claude reads them with an extended limit or writes a script itself for quick line search.
-
Agent Skills file to avoid repeated research on a new chat context
Created automatically when running the command
npx -y @backtest-kit/sidekick. This also allows you to ask regular Claude chat to use backtest-kit code for research by creating a docker container on the server side without touching the programmer's machine.
Additionally, since everything is open source, this can be run on any exchange, including those not available in TradingView or where the company has disabled the broker.
Fixing Pine Script
To combine data from different timeframes, you need to run two separate indicators simultaneously. The complete program code at the link already contains a caching mechanism for the higher 4h timeframe, calculations are optimized.
import { addStrategySchema } from "backtest-kit";
import { randomString } from "functools-kit";
import * as math_15m from "../../math/timeframe_15m.math.mjs";
import * as math_4h from "../../math/timeframe_4h.math.mjs";
import StrategyName from "../../enum/StrategyName.mjs";
import RiskName from "../../enum/RiskName.mjs";
addStrategySchema({
strategyName: StrategyName.MainStrategy,
interval: "5m",
getSignal: async (symbol) => {
const signalId = randomString();
const data_4h = await math_4h.getData(signalId, symbol);
// await pinescript.run(
// File.fromPath("timeframe_4h.pine"),
// { symbol, timeframe: "4h", limit: 100 }
// )
if (data_4h.noTrades) {
return null;
}
const data_15m = await math_15m.getData(signalId, symbol);
// await run(
// File.fromPath("timeframe_15m.pine"),
// { symbol, timeframe: "15m", limit: 100 }
// )
if (data_15m.position === 0) {
return null;
}
if (data_4h.allowShort && data_15m.position === 1) {
return null;
}
if (data_4h.allowLong && data_15m.position === -1) {
return null;
}
{
math_15m.dumpPlot(signalId, symbol);
math_4h.dumpPlot(signalId, symbol);
}
return await math_15m.getSignal(signalId, symbol);
},
riskList: [
RiskName.TakeProfitDistanceRisk,
RiskName.StopLossDistanceRisk
],
});
How Claude Code Uses This
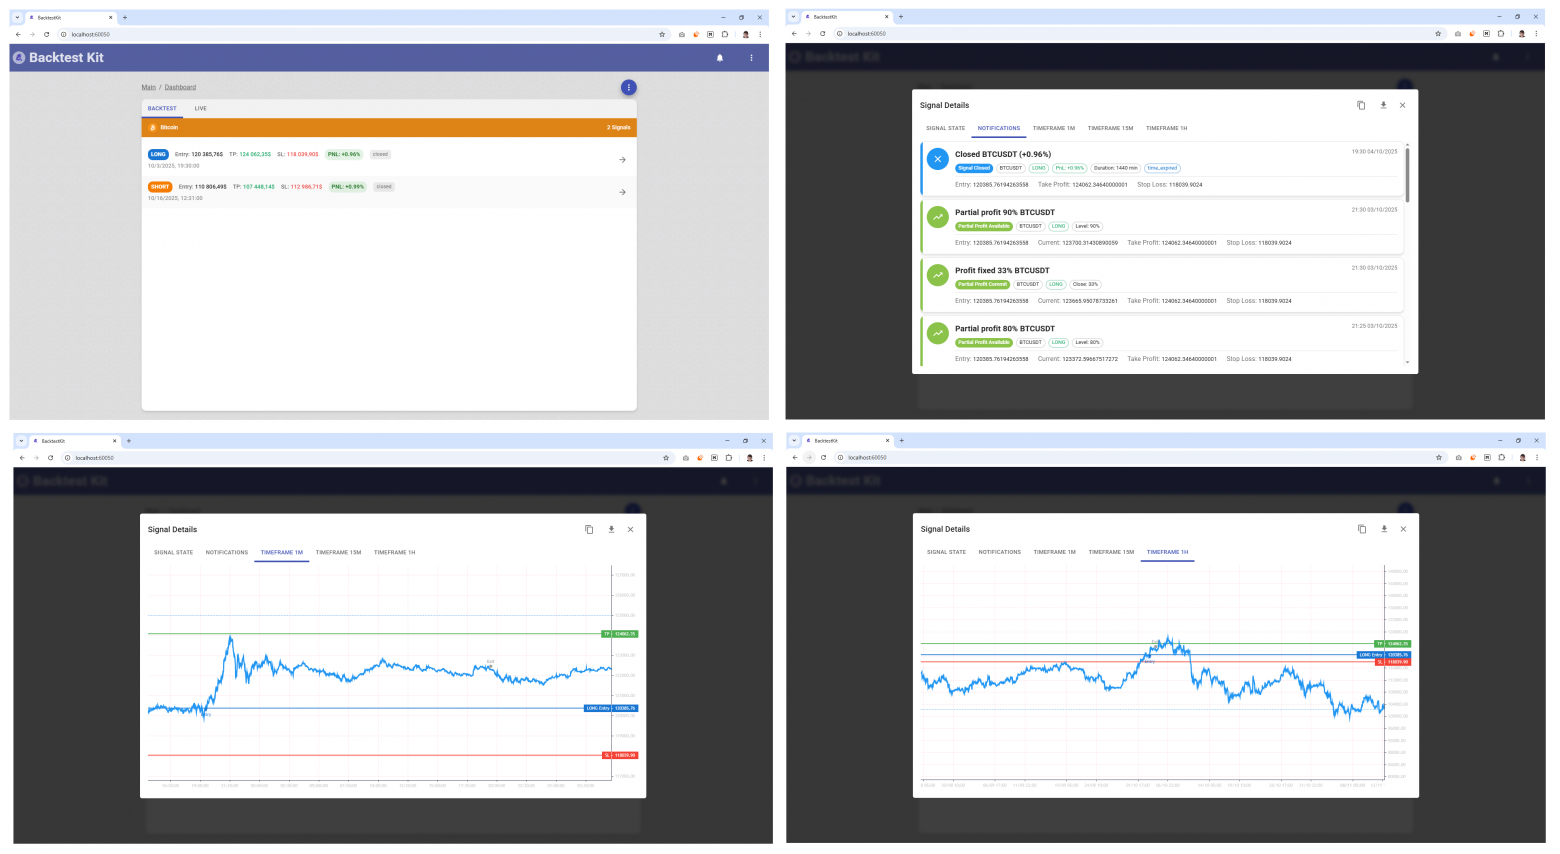
I won't be able to explain briefly. In the images you can see an example of exiting a position using Kelly: the price didn't reach TP, but a local spike (lower left corner) allowed earning 90% profit through partial exits on the 15-minute timeframe, despite the fact that the price then oscillated sideways (lower right corner) and on the hourly timeframe began to fall.
Not only technical, but also multi-timeframe and fundamental analysis is available. Anthropic has already created and maintains internet search tools for Claude, so it will find news on the internet itself and, if necessary, will only open short positions. Also, the @backtest-kit/ollama package and the async nature of the getSignal function allow searching for news and forecasts on the internet on the fly without changing the bot code. But the combination of Claude Code on the web plus GitHub Actions is significantly more convenient: you can give a command to adapt the strategy from an iPad while on vacation.
Example of Creating a Trading Bot
Human: Create a crypto trading bot using RSI divergence and volume confirmation
Claude Code:
npx @backtest-kit/sidekick crypto-bot
cd crypto-bot
# Reads generated Pine Script templates
cat config/source/timeframe_15m.pine
Claude Code: I see a template with EMA crossover. Modifying it for RSI divergence...
# Edits Pine Script strategy
cat > config/source/rsi_divergence.pine << 'EOF'
//@version=5
indicator("RSI Divergence Strategy")
// RSI calculation
rsi = ta.rsi(close, 14)
rsi_prev = ta.rsi(close[1], 14)
// Price divergence detection
bullish_div = close < close[5] and rsi > rsi[5] and rsi < 35
bearish_div = close > close[5] and rsi < rsi[5] and rsi > 65
// Volume confirmation
vol_spike = volume > ta.sma(volume, 20) * 1.5
// Signals
long_signal = bullish_div and vol_spike
short_signal = bearish_div and vol_spike
plot(long_signal ? 1 : short_signal ? -1 : 0, "Signal")
plot(close, "Close")
plot(close * 0.98, "StopLoss") // 2% stop
plot(close * 1.03, "TakeProfit") // 3% target
EOF
Claude Code: Running backtest on October 2025 (crypto crash period)...
npm start -- \
--mode backtest \
--frame October2025 \
--strategy rsi-divergence \
--symbol BTCUSDT
Backtest Results:
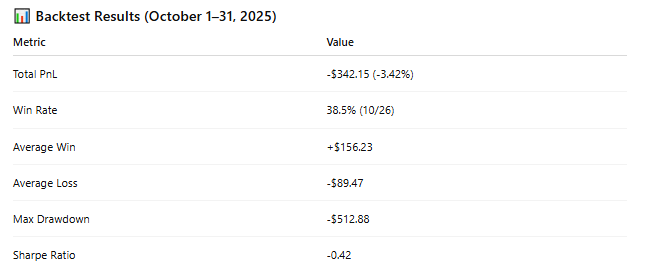
Claude Code: Hmm, losses during volatility. I'll add dynamic stops based on ATR and a trend filter...
# Modifies Pine Script
str_replace_editor \
--path config/source/rsi_divergence.pine \
--old_str "plot(close * 0.98, \"StopLoss\")" \
--new_str "atr = ta.atr(14)\nplot(close - atr * 2, \"StopLoss\")"
# Adds 4H trend filter
cat > config/source/trend_filter.pine << 'EOF'
//@version=5
indicator("Trend Filter 4H")
ema200 = ta.ema(close, 200)
bullish_trend = close > ema200
bearish_trend = close < ema200
plot(bullish_trend ? 1 : bearish_trend ? -1 : 0, "TrendBias")
EOF
Claude Code: Rerunning backtest with dynamic stops + trend filter...
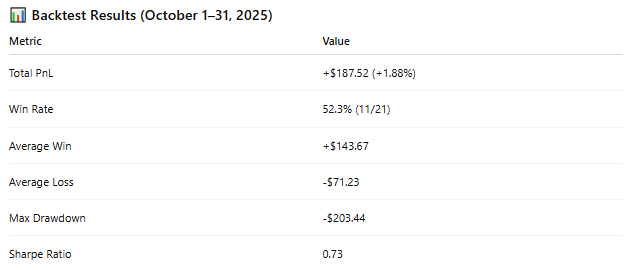
Claude Code: Strategy is now profitable. Deploying to paper trading for live validation...
npm start -- \
--mode paper \
--strategy rsi-divergence \
--symbol BTCUSDT
Thank you for Your Attention!